Superstore Analysis
Analyzed Superstore sales data using Python, SQL, and Tableau to uncover trends in revenue, profitability, discounts, and regional performance.
Tools Used: Python • Jupyter Notebooks • SQL • SQLite • Pandas • Tableau
Overview
The Superstore Sales Analysis project examines sales, profit, discounts, product performance, and regional trends to better understand the factors influencing business performance. Python and Pandas were used to clean and prepare the data, while SQLite and SQL supported deeper analysis of category profitability and product rankings. The results were then presented in an interactive Tableau dashboard designed to communicate key findings clearly and support data-informed decision-making.
Dataset
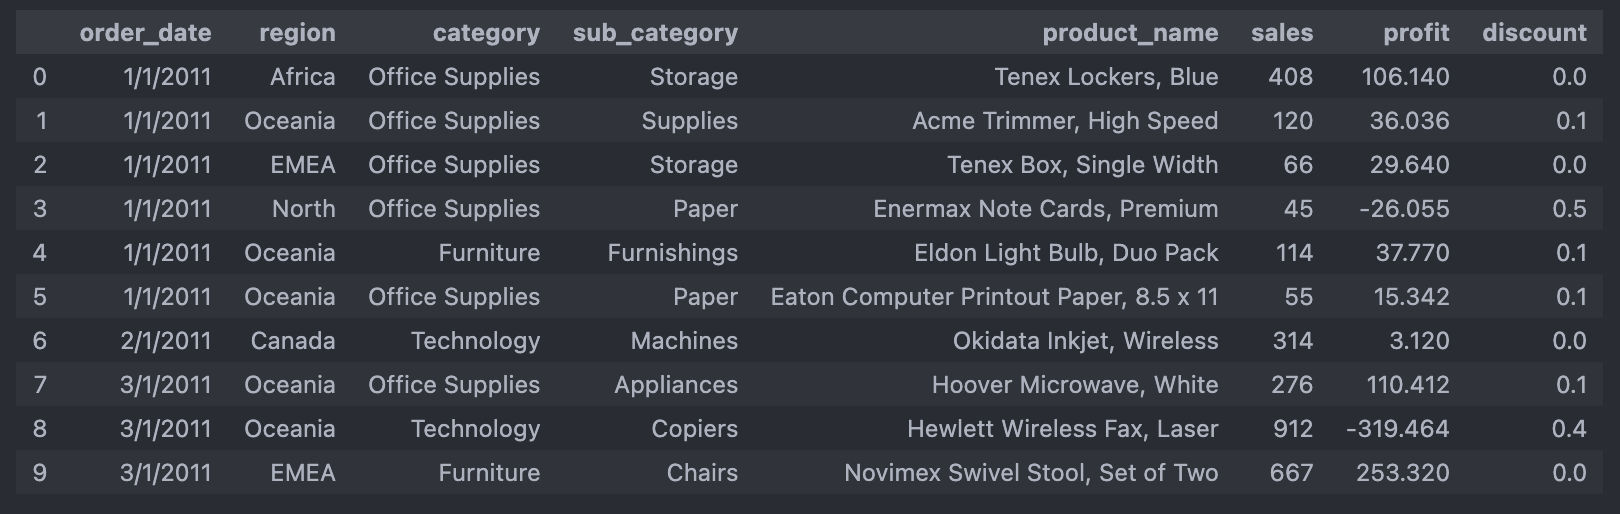
The dataset contains transactional sales records for a global superstore, including information about orders, customers, products, geographic regions, sales, profit, discounts, and shipping activity. Key fields used in the analysis included Sales, Profit, Discount, Category, Sub-Category, Region, Order Date, and Product Name.
Before analysis, the data was reviewed for missing values, inconsistent column names, and incorrect data types. Sales values were converted from text to numeric format, date fields were standardized, and additional calculated fields such as profit margin were created to support the analysis.
Attribute
Value
Source
Kaggle
Records
51,290
Features
Order Date, Region, Country, Category, Sub-Category, Product Name, Sales, Profit, Discount, and Quantity
Format
CSV
Tools
Python • Jupyter Notebooks • SQL • SQLite • Tableau
Why This Dataset?
The Superstore dataset was selected because it combines transactional, product, geographic, and financial data in a way that reflects common business-analysis challenges. It provides opportunities to examine sales performance, profitability, discount impact, seasonal trends, and regional differences while practicing data cleaning, SQL analysis, and dashboard development. It was especially useful for showing that high sales do not always lead to high profit, making it well suited for generating practical business insights.
Data Preparation
The dataset was prepared using Python and Pandas to ensure the fields were consistent and ready for analysis. Column names were standardized, date fields were converted into datetime format, and numeric fields such as Sales and Profit were checked and corrected where necessary. A calculated Profit Margin field was also created to support profitability analysis.
After cleaning, the prepared dataset was exported to a SQLite database so it could be queried with SQL. This created a repeatable workflow from raw data preparation through database analysis and Tableau visualization.
Data Quality Assessment
| Column | Findings | Action Taken |
|---|---|---|
| Missing Values | No major missing value issues in the fields used for analysis | Retained relevant records |
| Column Names | Some names contained spaces or inconsistent formatting | Standardized names for Python and SQL |
| Sales Data Type | Sales values were stores as text | Removed formatting characters and converted to numeric |
| Profile Data Type | Profit was numeric | Confirmed and retained |
| Data Fields | Order and shipping dates required conversion | Converted to datetime format |
| Calculated Metrics | Profit margin was not included in the raw data | Created a profit_margin field |
| Database Preparation | Data existed only in the original file | Exported the cleaned dataset to SQLite |
Cleaning Decisions
Analysis
Python Analysis
Python and Jupyter Notebook were used to inspect the dataset’s rows, columns, data types, and formatting. Inconsistent formats were corrected and standardized so the data could be analyzed reliably and SQL queries could run without errors or return incomplete or inaccurate results.
Loading the Dataset
                        import pandas as pd

                        df = pd.read_csv("superstore_sales.csv")

                        print(df.shape)
                        df.head()
The full Superstore dataset was loaded into a Pandas DataFrame so its structure, records, and fields could be reviewed before cleaning and analysis.
Inspecting Data Quality
                        print(df.info())
                        print(df.isnull().sum())
The dataset was inspected for missing values, incorrect data types, and formatting inconsistencies that could affect calculations or SQL queries.
Standardizing Data Types
                        df["Sales"] = (
                            df["Sales"]
                            .astype(str)
                            .str.replace("$", "", regex=False)
                            .str.replace(",", "", regex=False)
                            .str.strip()
                        )

                        df["Sales"] = pd.to_numeric(df["Sales"], errors="coerce")
                        df["Profit"] = pd.to_numeric(df["Profit"], errors="coerce")
Sales values were cleaned and converted from text to numeric format, while Profit was verified as numeric. This ensured that financial calculations and SQL aggregations could run correctly.
Feature Engineering
                        df["Profit_Margin_Percent"] = (
                            df["Profit"]
                            .div(df["Sales"])
                            .mul(100)
                            .where(df["Sales"] != 0)
                        )

                        df["order_date"] = pd.to_datetime(
                            df["order_date"],
                            errors="coerce"
                        )

                        df["ship_date"] = pd.to_datetime(
                            df["ship_date"],
                            errors="coerce"
                        )
A profit-margin percentage field was created to compare profitability across categories, products, and regions while safely excluding records with zero sales.
Exporting to SQLite
                        import sqlite3

                        with sqlite3.connect(...) as conn:
                            df.to_sql(
                                "superstore_sales",
                                conn,
                                if_exists="replace",
                                index=False
                            )
The prepared DataFrame was exported into a SQLite database, allowing the cleaned data to be validated and analyzed using SQL.
SQL Analysis
Once the formatting was corrected and the data was standardized, the cleaned dataset was loaded into a SQLite database. SQL was then used to analyze sales and profitability by category and identify the top-performing products within each category.
Sales and Profitability by Category
                        SELECT
                            Category,
                            ROUND(SUM(Sales), 2) AS total_sales,
                            ROUND(SUM(Profit), 2) AS total_profit,
                            ROUND(
                                100.0 * SUM(Profit) / NULLIF(SUM(Sales), 0),
                                2
                            ) AS profit_margin_percent
                        FROM superstore_sales
                        GROUP BY Category
                        ORDER BY total_sales DESC;
This query groups the data by product category and calculates total sales, total profit, and overall profit margin for each category. It helps compare revenue with profitability and shows that a category with strong sales may not necessarily produce the strongest profit margin
Top Products within each Category
                        WITH product_performance AS (
                            SELECT
                                Category,
                                Product_Name,
                                SUM(Sales) AS total_sales,
                                SUM(Profit) AS total_profit
                            FROM superstore_sales
                            GROUP BY
                                Category,
                                Product_Name
                        ),
                        ranked_products AS (
                            SELECT
                                Category,
                                Product_Name,
                                total_sales,
                                total_profit,
                                RANK() OVER (
                                    PARTITION BY Category
                                    ORDER BY total_sales DESC
                                ) AS sales_rank
                            FROM product_performance
                        )
                        SELECT
                            Category,
                            Product_Name,
                            ROUND(total_sales, 2) AS total_sales,
                            ROUND(total_profit, 2) AS total_profit,
                            sales_rank
                        FROM ranked_products
                        WHERE sales_rank <= 5
                        ORDER BY
                            Category,
                            sales_rank;
This query uses common table expressions and the RANK() window function to compare products within their own categories. It first calculates total sales and profit for each product, then ranks the products separately within each category to identify the top five by sales.
Dashboard
Tableau was used to create a dashboard that summarizes key business metrics, including total sales, profit margin, monthly sales trends, and discount patterns. Presenting these measures in one place allows viewers to quickly identify performance trends, compare results across the business, and understand how sales and profitability change over time.
Dashboard Design
The dashboard consist of 4 tables with 2 horizontal bar charts and 2 line charts, each focusing on a different business question.
Total Sales by Region
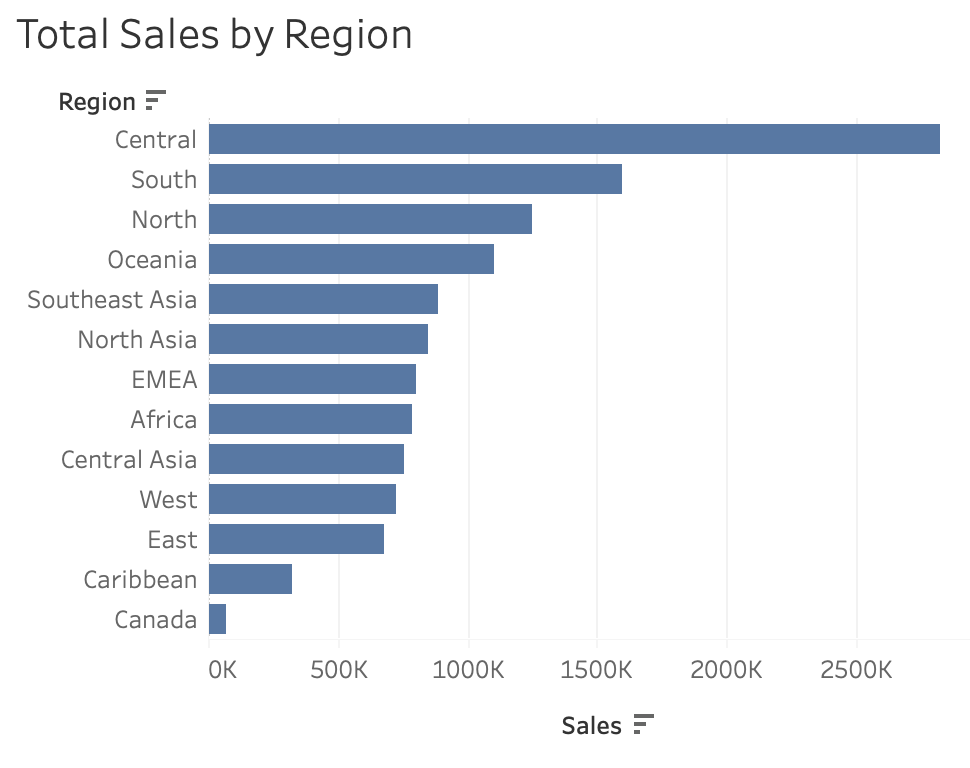
This horizontal bar chart compares total sales across regions. Central America generated the highest total sales, exceeding approximately $2.5 million, making it the strongest-performing region by revenue.
Profit Margin by Category
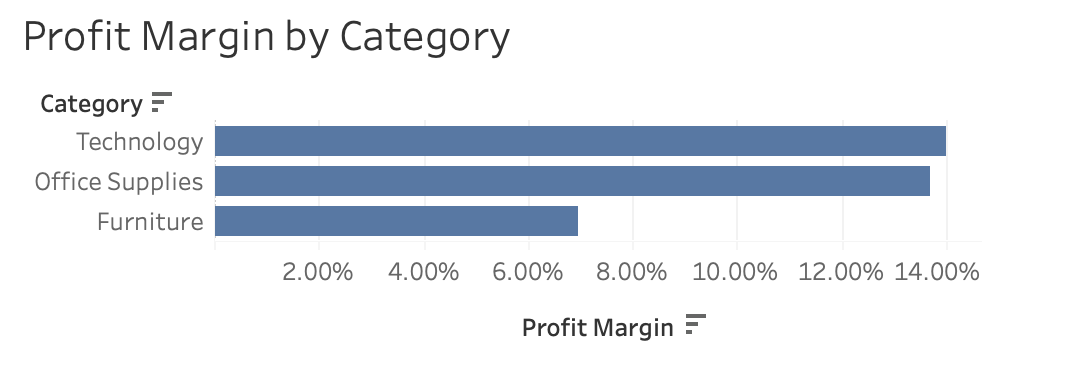
This chart compares profit margin across product categories. Technology had the highest profit margin at approximately 14%, with Office Supplies close behind. Furniture had the lowest margin, falling between roughly 6% and 8%.
Monthly Sales Trend
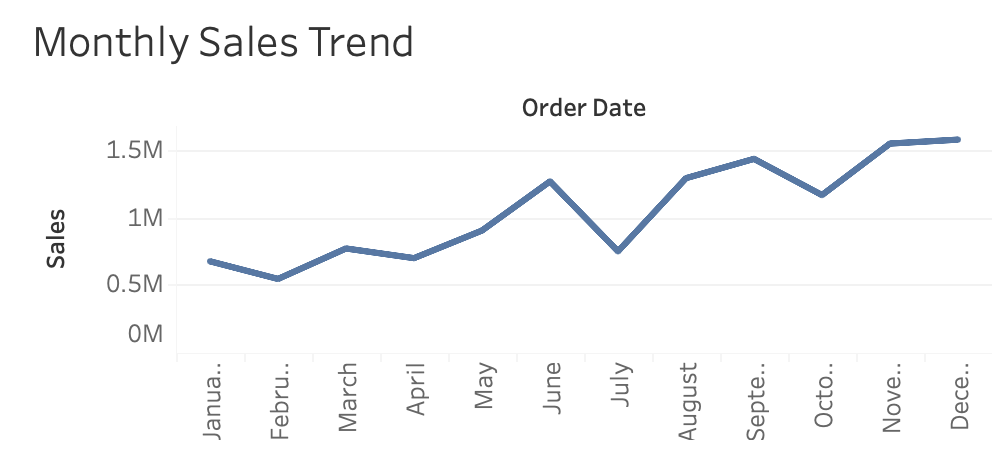
This line chart shows how sales changed throughout the year. Sales increased noticeably in June before declining in July, then reached their highest levels during November and December, suggesting stronger demand near the holiday season.
Discount vs Profit
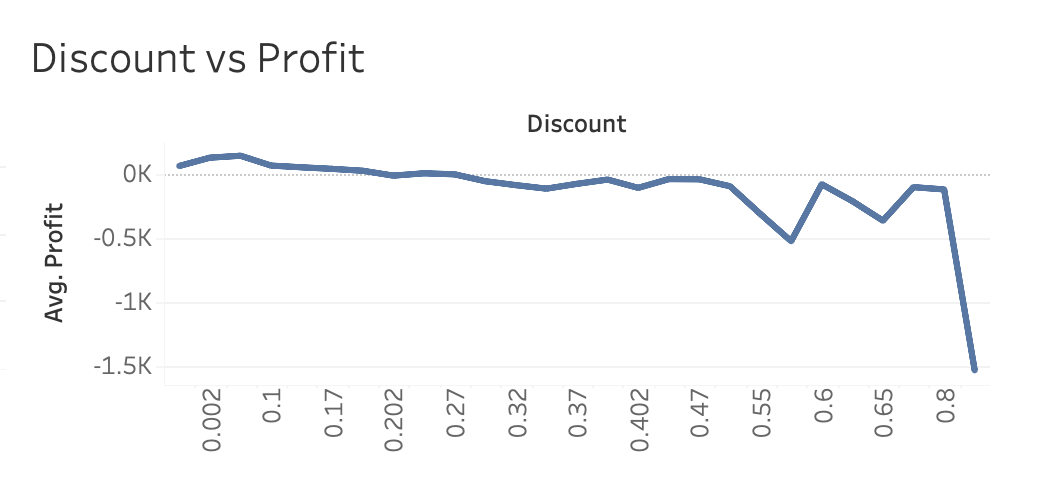
This line chart examines the relationship between discount levels and profit. As discounts increased, profitability declined significantly, indicating that higher discount rates were associated with weaker financial performance.
Key Insights
Challenges
One of the main challenges was preparing the dataset so that the financial fields could be analyzed consistently. Some values, such as Sales, were stored in a different format and had to be converted before calculations could be completed reliably.
Another challenge was comparing sales and profitability without treating them as the same measure. Some regions and categories generated strong revenue but produced weaker profit margins, so the analysis required looking at multiple metrics together rather than relying on sales alone.
The project also required organizing the cleaned data into a SQLite database and writing SQL queries that went beyond basic aggregation. Common table expressions and window functions were used to rank products within categories and make the analysis more detailed and reusable.
Lessons Learned
This project strengthened my understanding of how data cleaning, SQL analysis, and visualization work together in a complete analytics workflow. I learned that correcting data types and standardizing formats is essential because even small inconsistencies can cause calculations or queries to fail or return misleading results.
I also learned the importance of comparing multiple business metrics rather than relying on sales alone. Looking at profit margin, discounts, seasonal trends, and regional performance provided a more complete view of the business.
Finally, adding SQLite and more advanced SQL helped me practice using common table expressions, window functions, and ranking methods to answer more detailed business questions.
Project Resources
Interested in exploring the project further? View the source code or interact with the dashboard below.