Steam Games Analysis
Analyzing over 120,000 Steam games to uncover trends in pricing, player engagement, and recommendations using Python, SQL, and Tableau.
Tools Used: Python • SQL • SQLite • Pandas • Tableau
Overview
The video game industry generates massive amounts of data, from player engagement to pricing and user recommendations. For this project, I analyzed a dataset containing over 120,000 Steam games to explore trends across genres, pricing, popularity, and player recommendations. Using Python, SQL, and Tableau, I cleaned the raw dataset, transformed key fields, performed exploratory analysis, and created an i nteractive dashboard to communicate the results. The project demonstrates an end-to-end analytics workflow from raw data preparation to visual storytelling.
Dataset
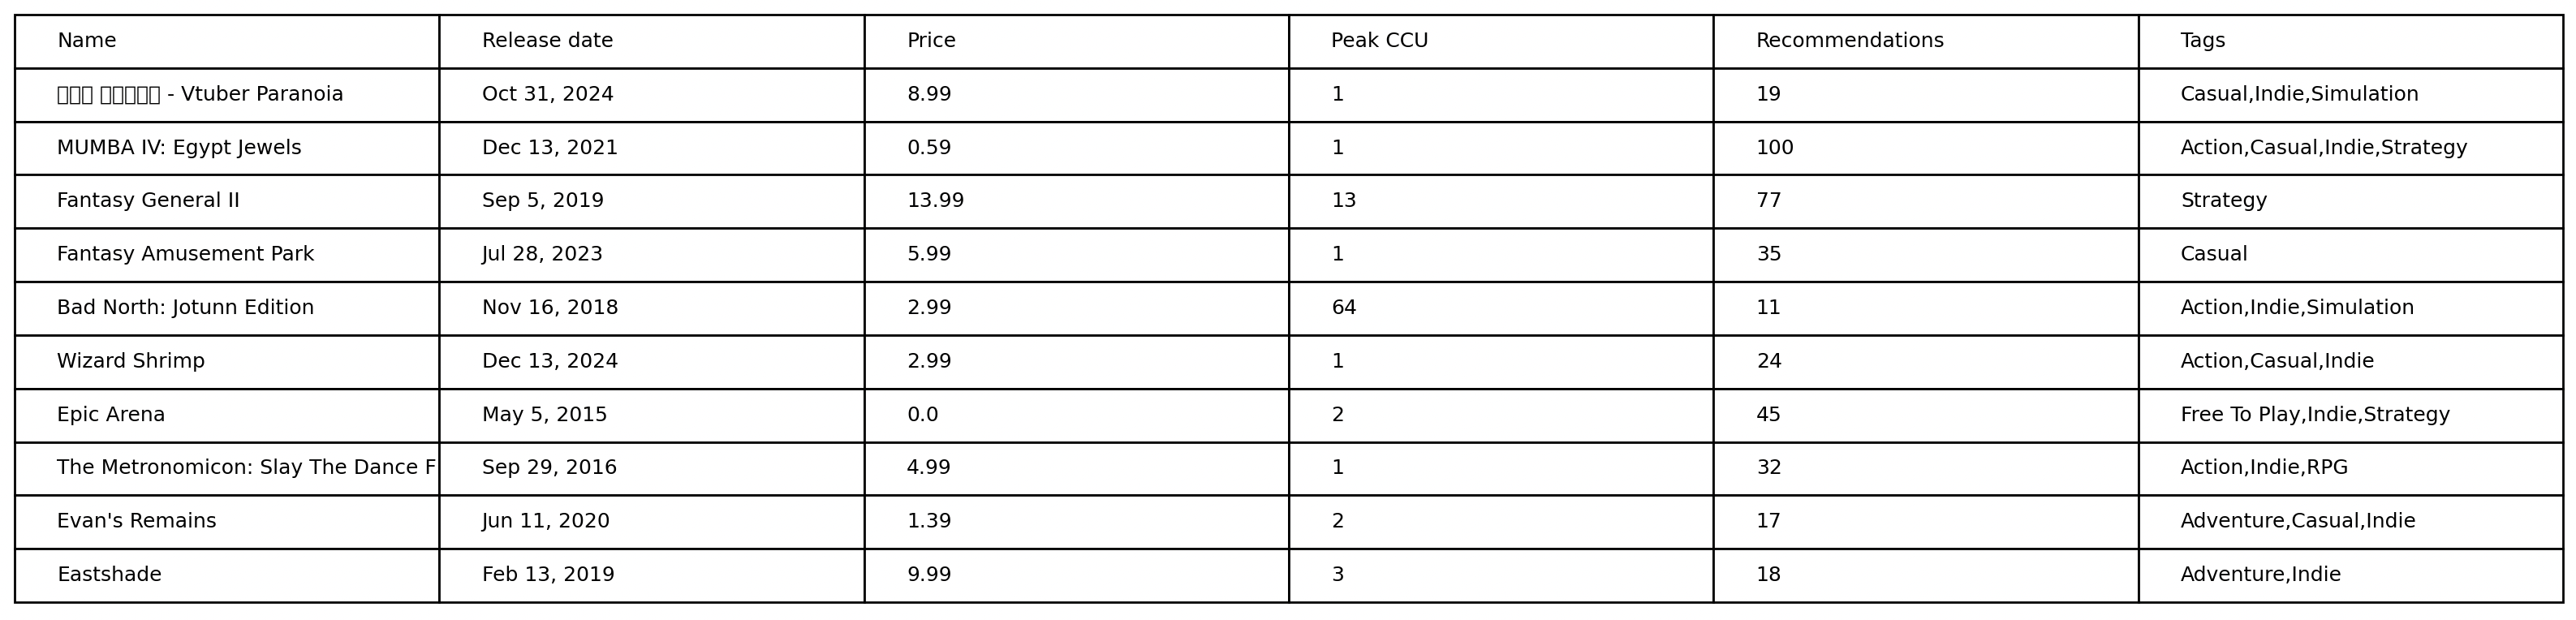
This project uses a publicly available dataset of 122,611 Steam games collected from Kaggle. The dataset includes information about each game’s pricing, genres, recommendations, player activity, release dates, review scores, and other metadata. The wide variety of available fields made it well suited for exploratory data analysis and provided opportunities to investigate relationships between pricing, popularity, player engagement, and game genres.
Attribute
Value
Source
Kaggle
Records
122,611 Steam Games
Features
Pricing, genres, recommendations, player counts, review scores, release dates, developers, publishers, and more
Format
CSV
Tools
Python • SQL • SQLite • Tableau
Why This Dataset?
I selected this dataset because it contains a large volume of real-world data with a diverse mix of numerical, categorical, and text-based fields. It provided an opportunity to practice the complete analytics workflow, including data cleaning, transformation, SQL analysis, and dashboard creation while answering meaningful questions about the Steam marketplace.
Data Preparation
Before performing any analysis, I evaluated the dataset for missing values, inconsistent data, and fields that required transformation. Cleaning the data ensured that the SQL queries and visualizations were based on reliable, meaningful information.
Data Quality Assessment
| Column | Missing Values | Action Taken |
|---|---|---|
| Achievements | 122,571 | Excluded from analysis due to extensive missing data. |
| User Score | 118,355 | Excluded from analysis due to insufficient data. |
| Header Image | 110,541 | Not relevant to the project objectives. |
| Support URL | 72,935 | Not relevant to the analysis. |
| Support Email | 68,469 | Not relevant to the analysis. |
| Tags | 8,413 | Retained and used to derive the Primary_Tag feature. |
| Categories | 8,909 | Retained for analysis despite a small number of missing values. |
| Genres | 8,953 | Retained for analysis despite a small number of missing values. |
Cleaning Decisions
Analysis
Python Analysis
Python was used to prepare the Steam dataset for analysis by filtering records, engineering new features, calculating summary statistics, and exporting the processed data for SQL queries and Tableau dashboards.
Loading the Dataset
                        columns_to_use = [
                            "Name",
                            "Peak CCU",
                            "Price",
                            "Recommendations",
                            "Genres",
                            "Tags",
                            "Metacritic score"
                        ]

                        df = pd.read_csv(
                            "cleaned_steam_data.csv",
                            usecols=columns_to_use,
                            low_memory=False
                        )
The dataset was imported using pandas while selecting only the columns required for analysis. Restricting the imported fields reduced unnecessary data and kept the analysis focused on relevant business metrics.
Filtering the Dataset
                        filtered_df = df[
                            (df["Recommendations"] > 0) &
                            (df["Peak CCU"] > 0)
                        ].copy()
Games with zero recommendations or zero peak concurrent users were removed to ensure averages and comparisons reflected active titles rather than inactive or incomplete records.
Feature Engineering
                        filtered_df["Primary_Tag"] = (
                            filtered_df["Tags"]
                            .fillna("Unknown") # Filters out anything with NaN
                            .str.split(",")
                            .str[0]
                        )

                        filtered_df["Primary_Tag"] = filtered_df["Primary_Tag"].replace(
                            "Massively Multiplayer",
                            "MMO"
                        )
Steam games often contain multiple descriptive tage. To simplify comparisons, the first tag was extracted and used as a new Primary_Tag feature. Standardizing "Massively Multiplayer" to "MMO" also improved consistency across the analysis.
Aggregating Insights
                        tag_ccu = (
                            filtered_df
                            .groupby("Primary_Tag")["Peak CCU"]
                            .mean()
                            .sort_values(ascending=False)
                        )
Python grouped games by their primary tag and calculated average values for key metrics such as Peak CCU, Recommendations, and Price. These aggregated datasets were later used for SQL analysis and dashboard visualizations.
Exporting to SQL
                        conn = sqlite3.connect("steam_analysis.db")
                        filtered_df.to_sql(
                            "steam_games",
                            conn,
                            if_exists="replace",
                            index=False
                        )
The transformed dataset was exported inot a SQLite database, allowing SQL queries to answer business questions and support additional analysis.
Visualization
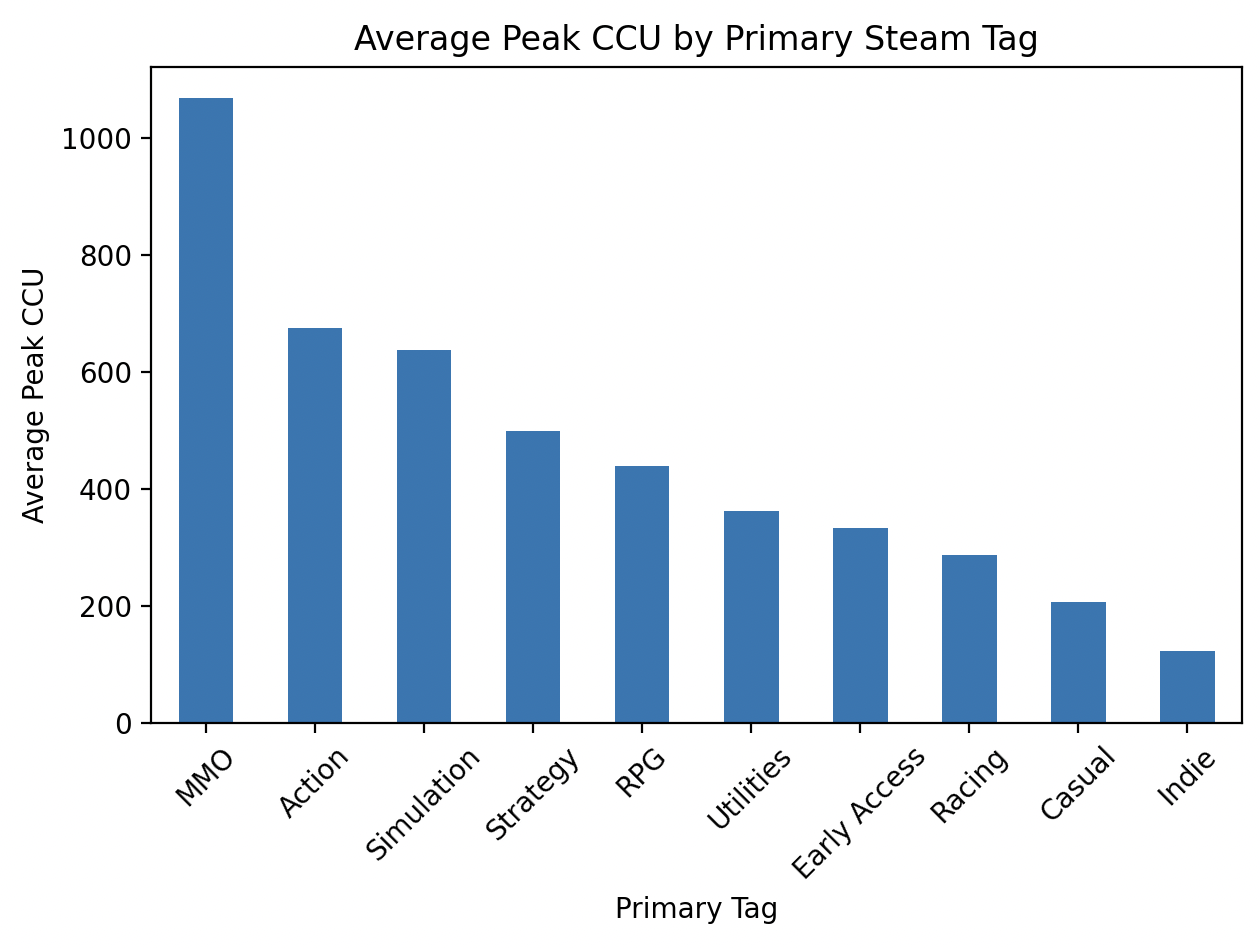
Matplotlib was used to generate exploratory visualizations that validated trends before building the final Tableau dashboard.
SQL Analysis
After preparing and exporting the dataset to SQLite, I used SQL to answer key business questions about Steam game performance. The queries focused on identifying trends in player engagement, community recommendations, and pricing across different game categories. Each query follows the same analytical pattern by grouping games according to their primary tag, calculating an average metric with AVG(), sorting the results in descending order, and returning the top ten categories. This approach made it easy to compare player engagement, recommendations, and pricing using a consistent methodology.
Average Peak Concurrent Players by Category
                        SELECT Primary_Tag,
                            AVG("Peak CCU") AS avg_ccu
                        FROM steam_games
                        GROUP BY Primary_Tag
                        ORDER BY avg_ccu DESC
                        LIMIT 10;
This query grouped games by their primary tag and calculated the average Peak Concurrent Users (CCU) for each category. Sorting the results in descending order highlighted the genres with the strongest player engagement. MMO titles had the highest average concurrent player counts, followed by Action and Simulation games.
Average Player Recommendations by Category
                        SELECT Primary_Tag,
                            AVG("Recommendations") AS avg_recommendations
                        FROM steam_games
                        GROUP BY Primary_Tag
                        ORDER BY avg_recommendations DESC
                        LIMIT 10;
This query measured average player recommendations by game category to identify which genres generated the strongest community approval. MMO was the most recommended category followed by Casual and Early Access.
Average Price by Category
                        SELECT Primary_Tag,
                            AVG("Price") AS avg_price
                        FROM steam_games
                        GROUP BY Primary_Tag
                        ORDER BY avg_price DESC
                        LIMIT 10;
This query calculated the average price for each primary tag to compare how games are priced across different genres. Sports games were the highest in average price followed by Early Access and Gore.
Dashboard
To communicate the results of my analysis, I developed an interactive Tableau dashboard that summarizes three key metrics across Steam game categories: average peak concurrent players (Peak CCU), average game price, and average player recommendations. By presenting these metrics in a single dashboard, users can quickly compare game categories and identify patterns in player engagement, pricing, and community reception.
Dashboard Design
The dashboard consists of three horizontally aligned bar charts, each focusing on a different business question.
Average Peak CCU by Primary Tag
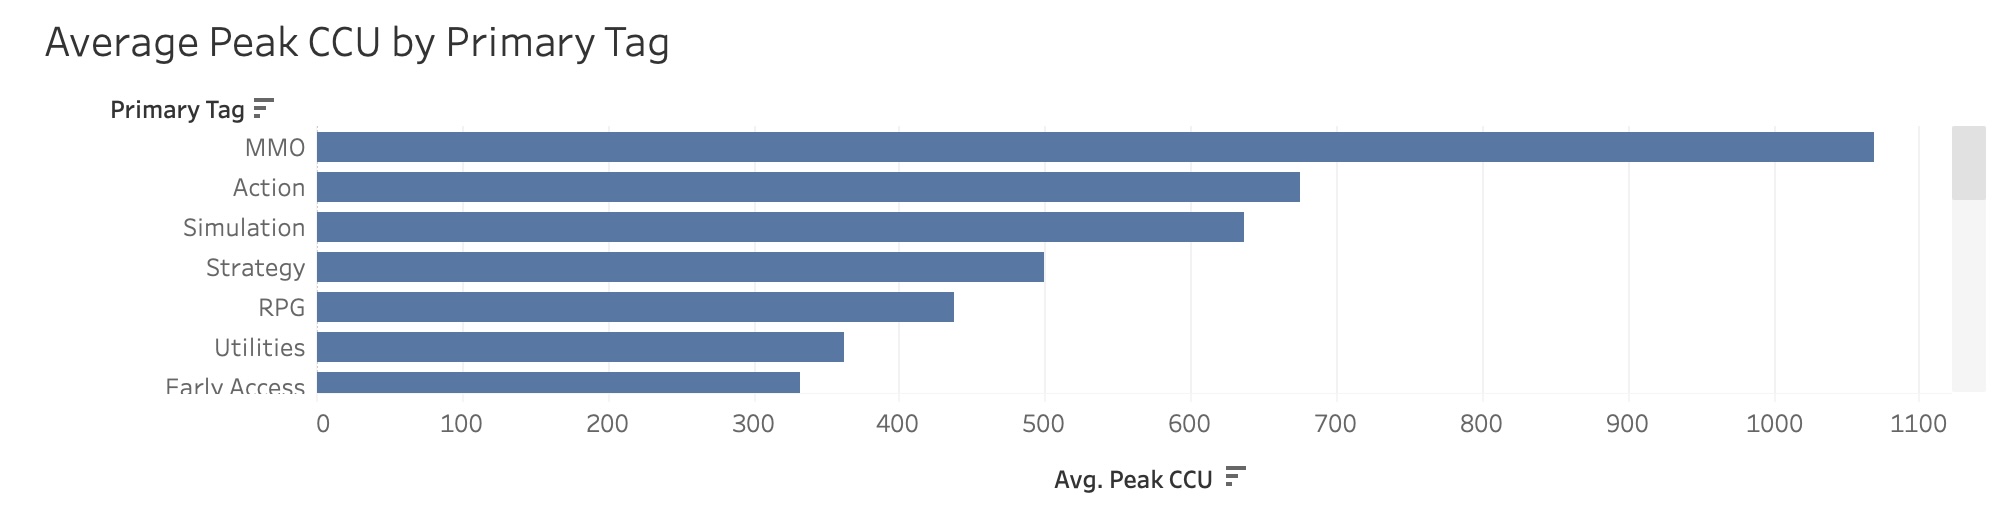
This visualization highlights which game categories attract the largest average number of concurrent players. A horizontal bar chart was chosen because it allows categories to be ranked from highest to lowest while keeping long category names easy to read. The chart makes it immediately apparent that MMO and Action games consistently generate the highest player engagement.
Average Recommendations by Primary Tag
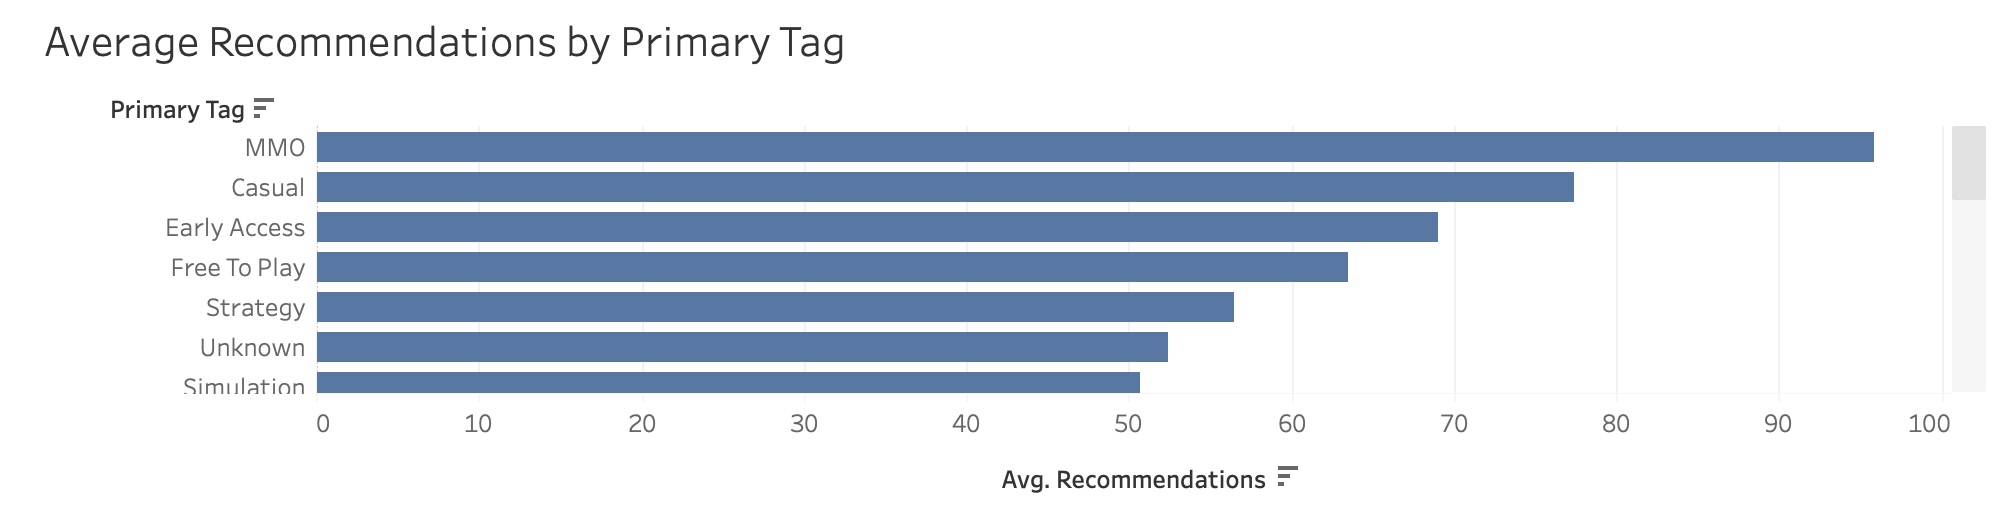
The final visualization focuses on community reception by displaying the average number of player recommendations for each category. Ranking the categories from highest to lowest makes it easy to identify which genres generate the strongest positive engagement from players, with MMO games leading the dataset.
Average Price by Primary Tag
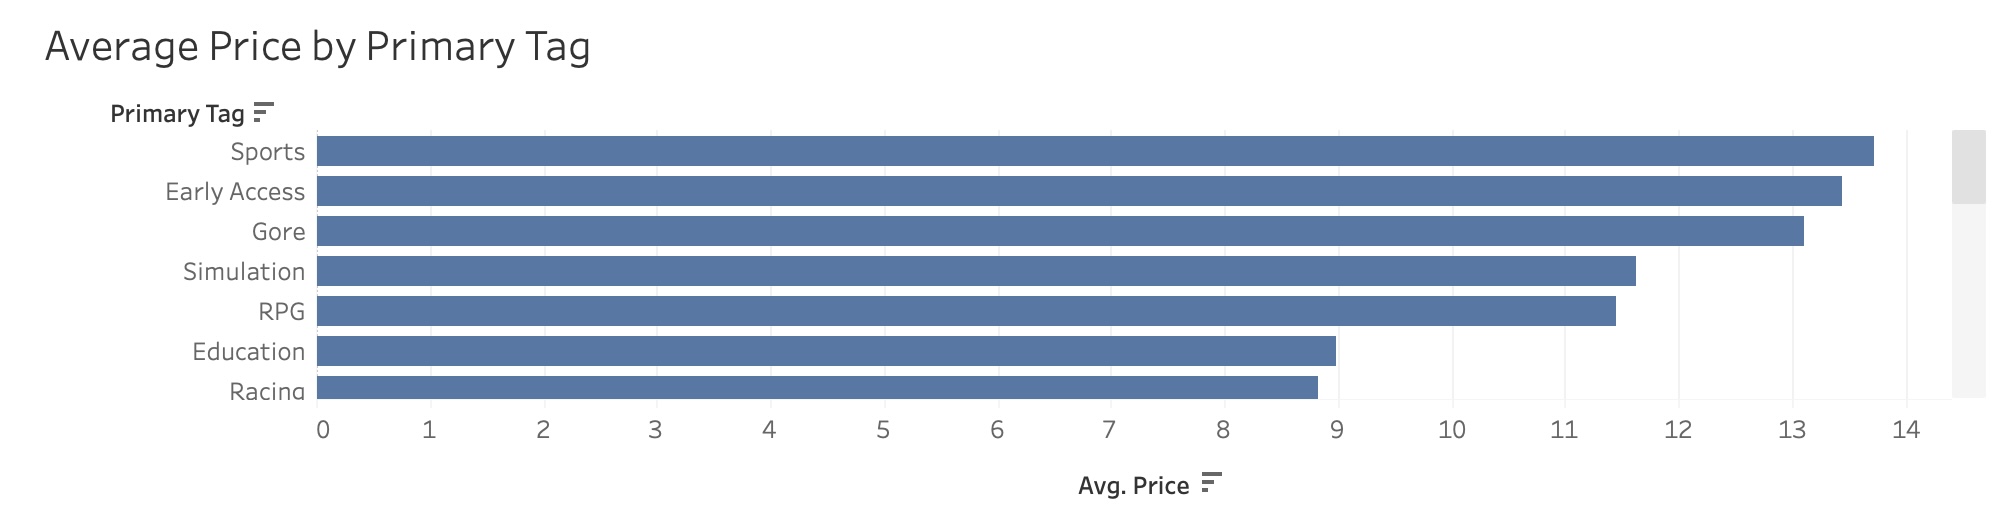
This visualization highlights which game categories attract the largest average number of concurrent players. A horizontal bar chart was chosen because it allows categories to be ranked from highest to lowest while keeping long category names easy to read. The chart makes it immediately apparent that MMO and Action games consistently generate the highest player engagement.
Dashboard Design Decisions
Outcome
The completed Tableau dashboard transforms the results of my SQL and Python analysis into an interactive visualization that makes it easier to explore trends across Steam game categories. Rather than reviewing individual query results, users can compare engagement, pricing, and recommendation metrics in a single interface, enabling faster analysis and clearer communication of insights.
Key Insights
MMO games attracted the largest player base
Massively Multiplayer (MMO) games recorded the highest average peak concurrent player count in the dataset, significantly outperforming every other game category. This suggests that MMO titles consistently maintain larger active player communities than most other genres.
Sports games had the highest average price
Sports games recorded the highest average listed price at $13.73, followed closely by Early Access titles. This indicates that these categories tend to command higher prices than many other Steam game categories.
MMO games received the strongest community engagement
MMO games also generated the highest average number of player recommendations. Their strong performance across both Peak CCU and recommendations suggests that these games not only attract large audiences but also encourage positive player engagement.
Different categories excel in different areas
While MMO games dominated player engagement and recommendations, Sports games led in average price. This demonstrates that no single category performed best across every metric, highlighting how different genres succeed in different ways.
Combining multiple metrics provies a more complete picture
Evaluating engagement, pricing, and player recommendations together revealed patterns that would have been difficult to identify using a single metric alone. The Tableau dashboard made it possible to compare these relationships side by side and communicate the results more effectively.
Challenges
Working with Missing Data
The original dataset contained a significant number of missing values across several columns, including achievements, user scores, playtime, screenshots, and support information. Before performing any analysis, I evaluated which fields were necessary for the project and removed or ignored columns that were not relevant to the research questions. This ensured the analysis was based on meaningful and reliable data.
Data Preparation and Cleaning
The raw dataset required additional preparation before it could be analyzed. I filtered out games with zero recommendations and zero peak concurrent players, standardized inconsistent tag names (such as renaming “Massively Multiplayer” to “MMO”), and created a new Primary Tag field to simplify comparisons between game categories.
Building a Consistent Analysis Pipeline
The project required coordinating multiple tools throughout the analysis process. Python was used for cleaning and transforming the data, SQLite was used to calculate aggregated metrics, and Tableau was used to visualize the results. Maintaining consistency between each stage of the workflow required careful validation to ensure that the data exported from Python matched the SQL queries and final dashboard visualizations.
Ensuring Meaningful Comparisons
Steam games often belong to multiple categories simultaneously, making direct comparisons difficult. To create consistent groupings, I extracted the first listed tag as each game’s primary category. While this simplified the analysis, it also required balancing data consistency with the recognition that many games span multiple genres.
Lessons Learned
This project strengthened my understanding of the complete data analysis workflow, from preparing raw data to presenting actionable insights through visualization. Working through each stage of the process reinforced the importance of building a reliable foundation before beginning any analysis.
I also gained valuable experience using multiple tools together within a single project. Python was used to clean and transform the data, SQLite was used to answer analytical questions, and Tableau was used to communicate the results through an interactive dashboard. Combining these technologies demonstrated how each tool contributes to an end-to-end analytics workflow.
Another important takeaway was the value of thoughtful data preparation. Creating a standardized Primary Tag field and filtering the dataset allowed for more meaningful comparisons between game categories, resulting in clearer and more reliable insights.
Finally, this project reinforced that effective data analysis extends beyond writing code or SQL queries. The ability to interpret results, identify trends, and communicate findings through clear visualizations is just as important as the technical implementation itself.
Project Resources
Interested in exploring the project further? View the source code or interact with the dashboard below.