Emoloyee Attrition Analysis
Explored workforce data using Python, SQL, and Tableau to identify the factors most closely associated with employee attrition and retention.
Tools Used: Python • Jupyter Notebooks • SQL • SQLite • Pandas • Tableau
Overview
I chose employee attrition data to identify patterns that may explain why employees leave a company. Python and SQL were used to clean and analyze the data to uncover the factors most closely associated with attrition. The findings were then presented in an interactive Tableau dashboard to communicate the results clearly.
Dataset
The dataset contains employee demographic, compensation, and workplace information used to analyze employee attrition. Factors such as overtime, monthly income, job satisfaction, and department were examined to identify patterns and determine whether they were associated with higher attrition rates.
Analysis Focus
Employee attrition, workforce trends, and retention factors
Source
Kaggle
Records
1,470
Features
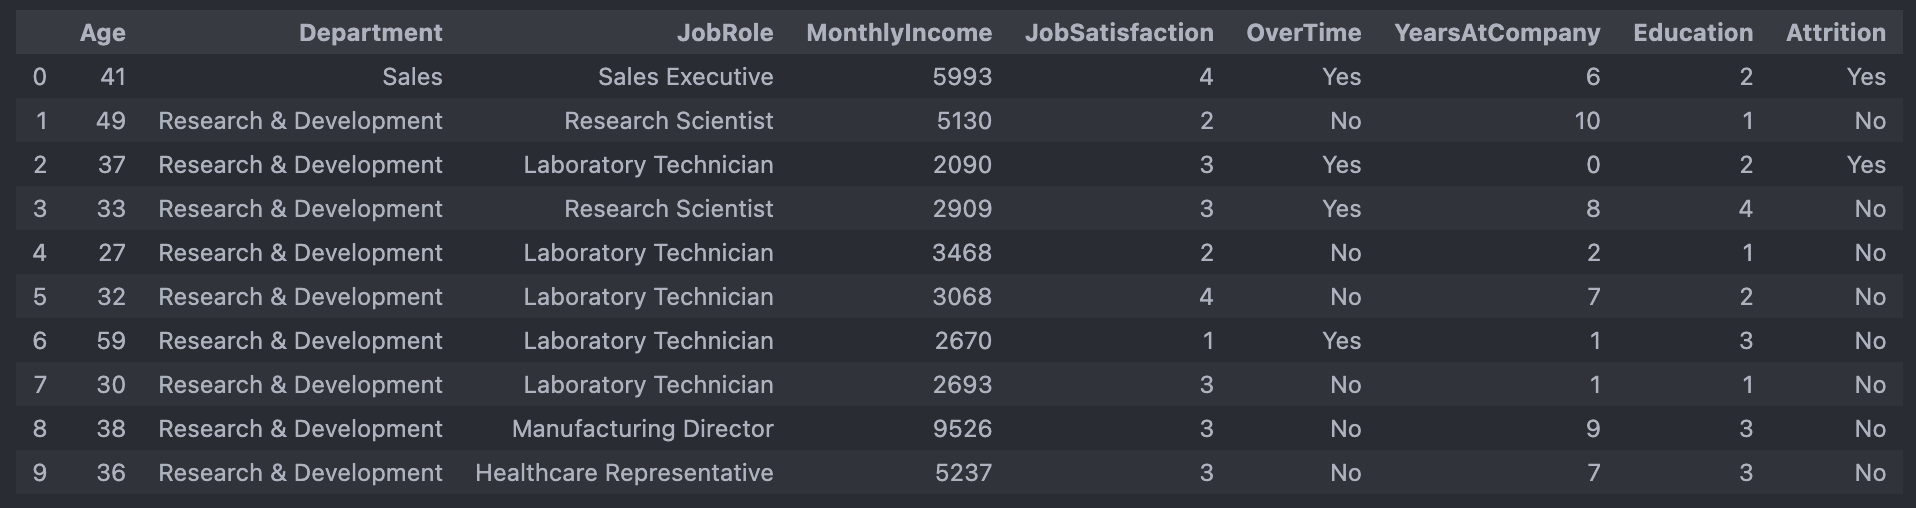
Age, Department, Job Role, Monthly Income, Job Satisfaction, Overtime, Years at Company, Education, and Attrition
Format
CSV
Tools
Python • Jupyter Notebooks • SQL • SQLite • Tableau
Why This Dataset?
I chose the employee attrition dataset because it included a variety of workplace, demographic, and compensation factors that could be compared against employee turnover. This made it well suited for exploring how factors such as overtime, job satisfaction, department, and monthly income may be associated with higher attrition rates while practicing data cleaning, SQL analysis, and dashboard development.
Data Preparation
The data was prepared using Python to ensure that formatting was consistent throughout the dataset. This allowed Python functions and SQL queries to execute without errors while helping ensure that the returned data was accurate.
Data Quality Assessment
| Data Quality Check | Findings | Action Taken |
|---|---|---|
| Column Names | Names were reviewed for consistency and readability. | Standardized column names where needed for easier Python and SQL analysis. |
| Missing Values | No significant missing values were found in the fields used for analysis. | Retained the dataset without removing records. |
| Data Types | Numeric and categorical fields were reviewed to ensure they matched the expected data types. | Verified and corrected data types where necessary. |
| Text Formatting | Categorical values such as Department, Job Role, Overtime, and Attrition were checked for consistency. | Removed extra whitespace and standardized formatting. |
| Database Preparation | The cleaned dataset needed to be queried using SQL. | Exported the prepared dataset into a SQLite database for further analysis. |
Cleaning Decisions
Analysis
Python Analysis
Python and Jupyter Notebook were used to inspect the dataset’s columns, rows, data types, and formatting. Inconsistent formatting was corrected and standardized so the data could be analyzed reliably and SQL queries could execute without errors. This preparation ensured that the workforce analysis was based on consistent and accurate data.
Loading the Dataset
                        import pandas as pd

                        df = pd.read_csv("WA_Fn-UseC_-HR-Employee-Attrition.csv")

                        print(df.shape)
                        df.head()
The full Employee Attrition dataset was loaded into a Pandas DataFrame so its structure, records, and fields could be reviewed before cleaning and analysis.
                        df.info()
                        print(df.dtypes)
                        print(df.isnull().sum())
The dataset was inspected to review column names, data types, and missing values before any cleaning or analysis began.
                        numeric_columns = [
                            "Age",
                            "MonthlyIncome",
                            "YearsAtCompany",
                            "JobSatisfaction"
                        ]

                        for column in numeric_columns:
                            df[column] = pd.to_numeric(
                                df[column],
                                errors="coerce"
                            )
Numeric fields were standardized to ensure consistent formatting and reliable analysis.
df['Attrition'].value_counts(normalize=True) * 100
Python was used to summarize employee attrition across key categories, providing an initial understanding of workforce trends before creating the dashboard.
Exporting to SQLite
                        import sqlite3

                        with sqlite3.connect(...) as conn:
                            df.to_sql(
                                "employee_attrition",
                                conn,
                                if_exists="replace",
                                index=False
                            )
The prepared DataFrame was exported into a SQLite database, allowing the cleaned data to be validated and analyzed using SQL.
SQL Analysis
Once the data was standardized in Python, the cleaned dataset was exported into a SQLite database for further analysis. SQL was then used to examine employee attrition by department, overtime, job satisfaction, and monthly income to identify the factors most closely associated with employee turnover.
                        WITH department_attrition AS (
                            SELECT
                                Department,
                                COUNT(*) AS total_employees,
                                SUM(CASE WHEN Attrition = 'Yes' THEN 1 ELSE 0 END) AS employees_left,
                                ROUND(
                                    100.0 * SUM(CASE WHEN Attrition = 'Yes' THEN 1 ELSE 0 END)
                                    / NULLIF(COUNT(*), 0),
                                    2
                                ) AS attrition_rate
                            FROM employee_attrition
                            GROUP BY Department
                        ),
                        ranked_departments AS (
                            SELECT
                                *,
                                RANK() OVER (
                                    ORDER BY attrition_rate DESC
                                ) AS attrition_rank
                            FROM department_attrition
                        )
                        SELECT *
                        FROM ranked_departments
                        ORDER BY attrition_rank;
This query uses common table expressions (CTEs) and a window function to calculate and rank each department by employee attrition rate. The results make it easy to compare departments and identify which areas of the organization experienced the highest employee turnover.
                        WITH employee_risk AS (
                            SELECT
                                EmployeeNumber,
                                Department,
                                JobRole,
                                OverTime,
                                JobSatisfaction,
                                YearsAtCompany,
                                MonthlyIncome,
                                Attrition,
                                CASE
                                    WHEN OverTime = 'Yes'
                                        AND JobSatisfaction <= 2
                                        AND YearsAtCompany <= 3
                                        THEN 'High Risk'
                                    WHEN OverTime = 'Yes'
                                        OR JobSatisfaction <= 2
                                        THEN 'Moderate Risk'
                                    ELSE 'Lower Risk'
                                END AS risk_group
                            FROM employee_attrition
                        )
                        SELECT
                            risk_group,
                            COUNT(*) AS employee_count,
                            SUM(CASE WHEN Attrition = 'Yes' THEN 1 ELSE 0 END) AS employees_left,
                            ROUND(
                                100.0 * SUM(CASE WHEN Attrition = 'Yes' THEN 1 ELSE 0 END)
                                / NULLIF(COUNT(*), 0),
                                2
                            ) AS attrition_rate
                        FROM employee_risk
                        GROUP BY risk_group
                        ORDER BY attrition_rate DESC;
This query uses a common table expression (CTE) and conditional logic to group employees into attrition risk categories based on overtime, job satisfaction, and years at the company. It then compares attrition rates across each risk group to identify which combination of factors is most strongly associated with employee turnover.
Dashboard
Tableau was used to create a dashboard that summarizes the key findings. Each chart in the dashboard examines how job satisfaction, overtime, monthly income, and department are associated with employee attrition, making the results easier to understand and compare.
Dashboard Design
The dashboard consist of 4 vertical bar charts, each focusing on a different business question.
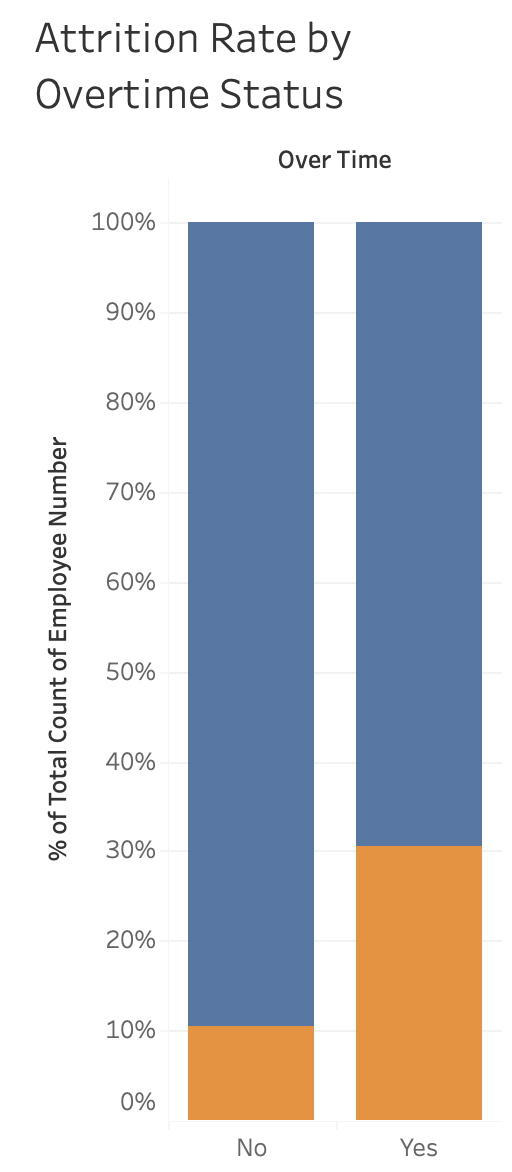
This vertical bar chart compares employee attrition rates based on overtime status. Employees who worked overtime had an attrition rate of approximately 30%, compared with around 10% for employees who did not work overtime.
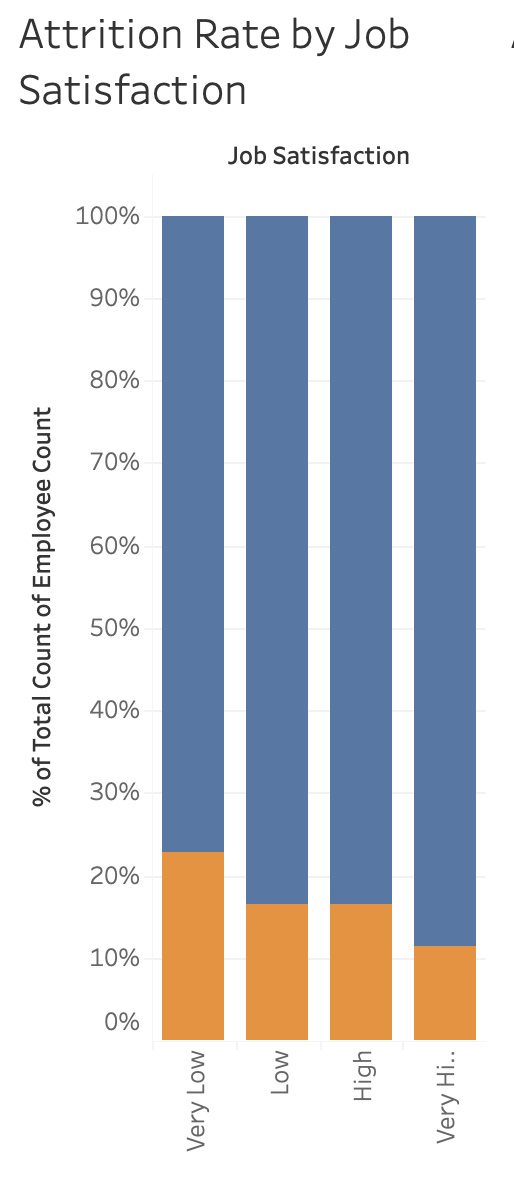
This vertical bar chart compares employee attrition rates across different levels of job satisfaction. Employees with very low job satisfaction experienced attrition rates between approximately 20% and 30%, while employees with very high job satisfaction had attrition rates just above 10%.
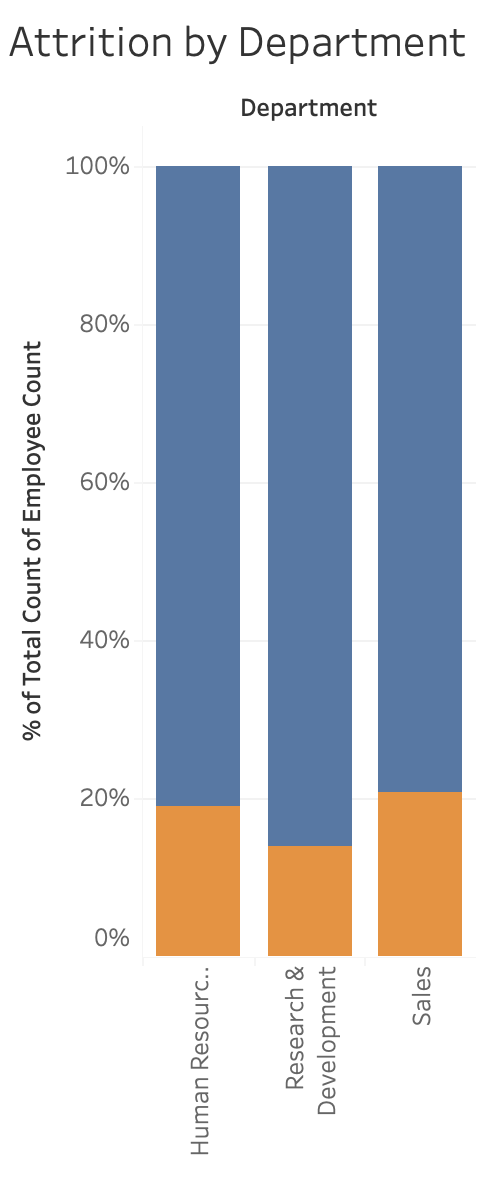
This vertical bar chart compares employee attrition rates across departments. Sales experienced the highest attrition rate at just over 20%, followed by Human Resources at just under 20%, while Research & Development had the lowest attrition rate.
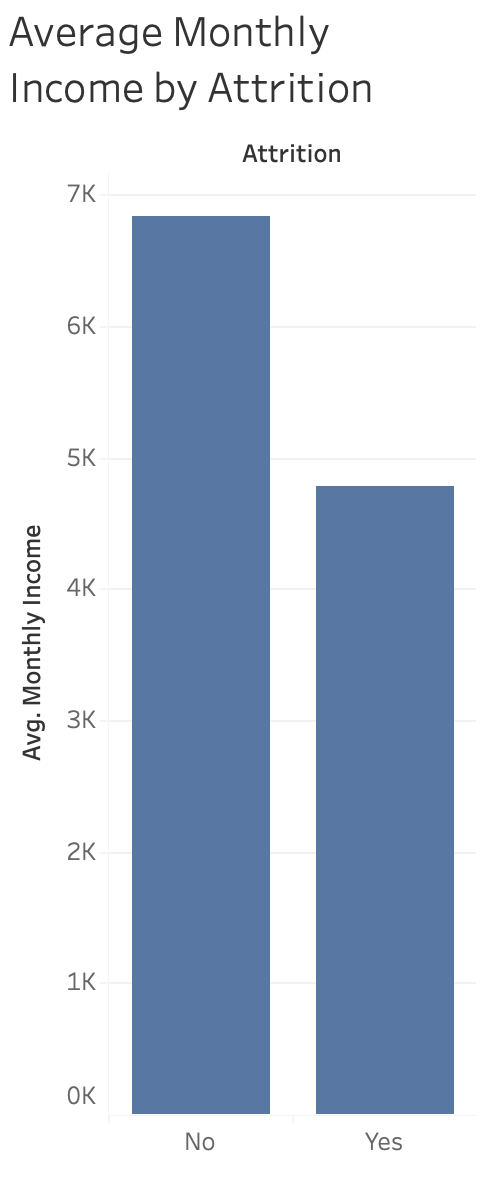
This vertical bar chart compares the average monthly income of employees who stayed with those who left the company. Employees who remained earned an average monthly income of nearly $7,000, while employees who left earned less than $5,000 on average, suggesting a relationship between lower income and higher attrition.
Key Insights
Challenges
One of the primary challenges was comparing multiple workplace factors to determine which were most strongly associated with employee attrition. Rather than relying on a single metric, the analysis required examining overtime, job satisfaction, department, and monthly income together to better understand employee turnover.
Another challenge was organizing the data into a format that supported reliable SQL analysis. Consistent formatting and standardized data types were necessary to ensure that Python functions, SQL queries, and Tableau visualizations produced accurate and consistent results.
Finally, creating more advanced SQL queries required combining common table expressions (CTEs), window functions, and conditional logic to analyze employee groups and identify meaningful patterns in attrition.
Lessons Learned
This project reinforced the importance of preparing data before beginning any analysis. Ensuring that data types, formatting, and values were consistent helped produce reliable Python analyses, SQL queries, and Tableau visualizations.
I also learned that employee attrition is influenced by multiple workplace factors rather than a single variable. Examining overtime, job satisfaction, department, and monthly income together provided a more complete understanding of employee turnover than looking at any one factor individually.
Finally, this project strengthened my SQL skills by applying common table expressions (CTEs), window functions, and conditional logic to answer more complex business questions. It also reinforced the value of combining Python, SQL, and Tableau into a complete analytics workflow.
Project Resources
Interested in exploring the project further? View the source code or interact with the dashboard below.